2013년 10월 19일 토요일

Linux Mint 설치 후 기본 설정들

웹서핑을 하다가 http://blog.daum.net/bagjunggyu/18 이글을 읽고 리눅스 민트를 설치해봤다.

설치 방법은 위 링크에 있고 어렵지 않다.


32bit냐 64bit냐..

32bit와 64bit중 어느 것을 선택하느냐인데..
쓰는 컴이 64bit 프로세서라면 당연 64bit를 쓰는 게 좋다.
64bit 컴을 쓰는 나도 처음에 별 생각없이 64bit 버전으로 설치했다가 살짝 후회한 게 다음 클라우드가 2013년 10월 현재 32bit 리눅스만 지원하고 있다는거.. ㅠㅜ

그래서 32bit를 설치하려고 알아보다 보니 반가운 링크가 있었다.
http://bagjunggyu.blogspot.kr/2012/09/12.html

저 분도 나처럼 50G나 제공해주는 다음클라우드를 애용하시는 모양인데, 아뭏든 위 링크와 다르게 내 경우는 32bit로 부팅 USB를 만들어 설치할 수가 없었다.
32bit 버전으로는 Windows 7에서는 부팅 USB는 만들어지지만 재부팅 시 부팅 USB에 있는 grub이 실행되지 않고, 리눅스에서는 부팅 USB를 만드는 과정이 끝까지 수행되지 않고 부트로더 설치를 위한 암호 입력 직후에 비정상 종료되어 버린다.
(리눅스에서 부팅 USB 만들기 : http://bagjunggyu.blogspot.kr/2012/11/linux-mint-maya-booting-usb.html

결론적으로
- 다음클라우드를 사용하고 싶다면 32bit 를 설치한다.
- 단, 64bit 컴퓨터인 경우 32bit 리눅스 설치가 불가능할 수 있으며 이때는 64bit 리눅스를 설치하면 되지만 다음클라우드는 사용할 수 없다. (단, 윈도우 듀얼 부팅 사용자의 경우는 민트에서도 윈도우 파티션에 저장되어 있는 다음클라우드 폴더에 쓰기를 할 수 있으므로 원하는 파일을 다음클라우드 폴더에 저장해두면 나중에 윈도우로 부팅하면 동기화가 된다 ㅋ)


부팅 USB 만들고 설치하기

자 그럼 32bit든 64bit든 설치하기로 마음 먹은 배포판을 다운로드 받고  http://bagjunggyu.blogspot.kr/2012/09/maya_26.html 를 참조하여 Windows 7에서 리눅스 민트 부팅 USB를 만들어 리눅스 민트를 설치한다.

기쁜 마음으로 USB를 뽑고 재부팅을 해서 grub이 뜨면 OK.

그러나 내 경우 grub이 뜨질 않고 그냥 Windows 7로 부팅이 되어버리는 것이다..
찾아보니 요새 나온 컴은 BIOS가 EFI 방식이라 grub가 설치되지 않을 수도 있단다. 자세한 건 여기

그래서.. 리눅스 민트를 사용하려면 일단 grub부터 설치해야 한다.

물론, 정상적으로 grub이 실행되었다면 아래의 grub 설치는 건너뛰는거다.


부팅 USB로 grub 설치

설치 방법은 여기에 있다.
글이 길고 영어라.. 한글로 요약하면 다음과 같다.

0. 일단 리눅스 민트 부팅 USB로 부팅
1. 좌하단 '메뉴'를 클릭하고 'Gparted'를 입력하여 Gparted를 선택한 후 실행하여 리눅스 민트가 설치된 디바이스명,번호 확인


2. sudo mount /dev/sdXY /mnt 로 리눅스 민트가 설치된 파티션을 마운트한다. 물론 여기에서의 'sdXY'는 각자의 Gparted 실행 결과에 따라 변경해야 한다. 내 경우엔 sudo mount /dev/sda5 /mnt
3. sudo grub-install --root-directory=/mnt /dev/sdX 로 grub 설치. 마찬가지로 여기에서의 'sdX'는 각자의 Gparted 실행 결과에 따른다. 내 경우엔 sudo grub-install --root-directory=/mnt /dev/sda

그런데 문제는 3번을 수행하면
grub-probe : failed to get canonical path of /cow 라는 에러 메시지가 보이는데,
그 바로 아래줄에 Installation finished. No error found. 라는 메시지가 뜬다면 grub이 어쨌거나 설치된 것이므로 위의 에러 메시지는 무시해도 된다. 게다가 grub은 어차피 아래의 한글 설정 하면서 재설치를 할 예정이다.

재부팅을 해보면 grub이 실행되고 여기서 linux mint를 선택하면 리눅스 민트로 부팅 가능~ ^^


grub 설치

이건 Linux Mint Petra 16 을 새로 설치하고 나니 발견한 증상인데,
부팅할 OS를 선택할 수 있는 grub 이 뜨지도 않고 바로 리눅스로 부팅. ㅠㅜ;

/boot/grub/grub.cfg 파일에 windows 라는 문자열이 없다.
즉, 설정이 안되어 있다는..

다소 어이 없지만 grub이 설치가 안되어 있는게 문제.

해결책도 어이 없게 쉽다. grub 을 설치 해주면 된다.

sudo apt-get install grub-pc

실행 하면 아래의 그림이 나온다.
이건 GUI가 아니니 마우스로 '확인' 누르지 마시고 ㅋ
오른쪽 화살표 누르면 '확인'이 활성화된다. 엔터를 누른다.


다음에는 grub을 설치할 위치를 선택한다.
내 경우엔 sda에 윈도우7과 리눅스민트가 같이 설치되어 있으므로 sda를 선택한다.
선택 방법은 역시 마우스 클릭은 아니고, 스페이스를 누른다. 그럼 * 표시가 나온다.
선택 했으면 Tab을 누르면 '확인'이 활성화 된다. 이 상태에서 엔터를 누른다.


보는 것 처럼 자동으로 Windows 7 이 있다는 것을 알아서 찾아준다.


확인 삼아 /boot/grub/grub.cfg 파일을 열어보면 windows 라는 문자열을 찾을 수 있다.
기본 부팅 OS는 자동으로 리눅스로 되어 있는데, 윈도우즈로 바꾸려면 아래에 보이는 숫자를 '적당히' 바꿔줘야 한다.
무엇이 적당한 값인지는 재부팅하고 grub이 뜨면 windows가 선택 목록의 몇번째에 나오는지 확인하면 된다. 리눅스를 새로 설치했다면 보통은 5번째에 나오며, grub.cfg 파일은 0부터 카운트 하므로 4로 바꿔주면 다음 부팅부터는 기본적으로 윈도우즈가 선택된다.


한글 설정

<<업데이트>>
Linux Mint Petra 16을 설치했다면 반드시 여기 를 참조!
<<업데이트>>

아래 내용은 Linux Mint Olivia 15 기준임.

리눅스는 일단 부팅 성공했으면 한글부터 테스트 하는거다.
리눅스 민트 15 올리비아도 역시나(?) 아직 아무 설정없이 한글을 쓸 수 있게 되어있지는 않다. 설정 자체가 이젠 많이 쉬워졌다는 것으로 위로를 ^^

암튼 한글 설정을 따로 해줘야 하는데, 아래의 링크가 가장 깔끔하게 설명되어 있다.

http://bagjunggyu.blogspot.kr/2012/09/linux-mint-13-maya-mate.html


아, 위 블로그 내용 중 grub 재설치 하고 grub.cfg를 설정하는 부분에서

sudo pluma /boot/grub/grub.cfg


이런 내용이 있는데, pluma라는 명령어가 없다고 나오는 경우 그냥

sudo vi /boot/grub/grub.cfg 라고 하고 편집 내용은 아래의 링크를 참조한다.

http://bagjunggyu.blogspot.kr/2012/09/os-grub.html


Alias 설정

아래 내용은 Olivia에 해당하는 내용이고,
Petra 16 에서는 ll이 기본으로 먹는다.

이건 뭐 개인에 따라 다른데, 기본적으로 리눅스 민트의 터미널에서는 ll 이 먹지 않는다.
대단한 건 아니지만 ll 을 써오던 입장에서는 없으면 꽤 불편하니 설정하도록 한다.
로그인 한 사용자로 ll을 쓸 수 있게하려면,

vi ~/.bashrc
로 새 파일 편집모드로 가서

alias ll='ls -alh --color=auto'
를 추가하고 저장하고 다시 터미널로 나온다.

참고로 옵션의
  a는 모든 파일,
  l는 목록 형식,
  h는 kilobytes 단위 표시
를 의미한다.

바로 적용하려면 터미널에서

source /etc/profile.d/alias.sh
를 실행하면 ll 을 바로 사용할 수 있고, 터미널을 껐다 켜도 ll을 사용할 수 있다.

원격 접속 데몬

ssh 클라이언트는 기본으로 깔려있지만,
외부의 원격 컴퓨터에서 내 리눅스에 ssh로 접속할 수 있도록 ssh 서버를 별도로 설치한다.

sudo apt-get install openssh-server


기본은 22번 포트에 Listen 하는데,
포트 변경은 /etc/ssh/sshd_config 파일의 Port 를 원하는 번호로 수정하고,
sudo service ssh restart 로 재시작 하면 변경된다.

netstat -nl | grep ssh 로 변경된 포트 번호를 확인할 수 있다.


기타.. 

나처럼 리눅스가 왠지 정이 가서 너무 깊게 파지 않는 수준에서 이것저것 해보고 싶은 사람은 리눅스 민트를 설치하는 것을 강력히 추천한다.
이유는 리눅스 민트가 다른 리눅스보다 너무 좋아서....
가 아니라 위에서 여러차례 인용한 http://bagjunggyu.blogspot.kr 의 주인장인 https://plus.google.com/101028813073033149665/posts 박정규님 덕에 웬만한 장애물은 쉽게 건너갈 수 있기 때문이다. ^^


2013년 10월 11일 금요일

Realtime Streaming Chart using D3.js - 03. Streaming the Axis

Code and the Result


Add a button to toggle streaming the axis

I want to add a feature that can streaming the X-axis.
So I add <button> in the html, and add a jQuery click event handler, which toggles the streaming feature.


Streaming, the mechanism

Well, I selected the word 'streaming' because the X-axis flew to the left constantly.
But from the view point of the mechanism, 'streaming' may not be the proper word.
'Periodic Smooth Shifting' is probably more accurate.
Actually, 'streaming' consists of 3 parts as you can see the code above.
  • Updating the domain of the axis
  • Animate the change of domain of the axis
  • Repeating periodically


D3 stuff in this code

xScale.domain()
  Refer to here - 01. Draw SVG and Axes


gXAxis.transition()
  selection.transition() starts and returns the 'transition' of the selection. Transition is an object derived from the selection and it enables the selection to animate.


transition.ease("linear")
  transition.ease(value[, arguments]) specifies the easing function and returns the transition. 'transition.ease("linear")' means there is no acceleration in the animation, so the animation proceeds at a constant speed. See this page for the easing functions.


transition.each()
  transition.each([type, ]listener) will executes 'listener' when the 'type' event dispatches. The 'type' is "start" or "end".


So the code above does,
update the domain of the xAxis using scale() method,
and provide xAxis with the animation-enabled selection,
and reinvoke the 'shiftXAxis' function whenever each transitions ends.


Summary

We streamed the axis by
1. updating the domain of the axis
2. animating the change of the domain of the axis
3. repeating periodically.


What's next?

X-axis represents just a number for now.
Streaming the 'time' rather than just a number can produce more values in the real world.
We are going to change the X-axis so it can represent the 'time'.

go Back | go Next


2013년 10월 1일 화요일

Qt Creator needs a compiler set up to build. Configure a compiler in the kit options.

If you want to use Qt in Windows 7, just choose the 'Qt 5.1.1 for Windows ... (MinGW ...)', like below.


And add the MinGW to your installation process like below.


Or, I bet you would face the trouble like I did below.

---------------------------

I tried to use Qt in Windows 7 64bit.
So I chose the link below.


  • Qt 5.1.1 for Windows 64-bit (VS2012, OpenGL ...)


The installation was OK, but executing a sample application in Qt Creator totally frustrated me with the error message:
Qt Creator needs a compiler set up to build. Configure a compiler in the kit options.

I googled and the answers were about installing MSVC... something like that.

So I googled again and finally downloaded the file: vc_compilerCTPNov2012.exe

But.. I'm disappointed again with the error below


I just don't want to get involved with Visual Studio stuffs.
So I just chose another installation file which uses MinGW instead of MSVC stuff, even though that's for 32 bit.
And I included the MinGW installation during the installation process, then I was good to go.

2013년 9월 29일 일요일

Realtime Streaming Chart using D3.js - 02. Draw a Point

The Code and the Result


Add a button to draw a point on the chart

I want to add a point(circle) on the chart.
So I add <button> in the html, and add a jQuery click event handler, which makes a new data and draw a circle on the chart.


SVG circle

D3 is based on SVG. So the result of the D3 chart consists of SVG tags.
Here I will draw a point using SVG circle, and it look like this:

<circle cx="454" cy="92" r="4" style="fill: #893af5;"></circle>

'cx', 'cy' means the location of the X, Y originated from the Top-Left corner of the SVG.
'r' means the radius of the circle
'style' is just a css style to display the circle.

Our goal is simple.
Produce the HTML code above with our own data.
D3 plays a key role here.


D3 stuff in this code

selection.datum(data)
  selection.datum([value]) returns the selection after binding the value to that selection.
  So using selection.datum(), we can bind our own data to the SVG circle.

selection.attr("cx", function (d) { return xScale(d.x); })
  selection.attr(name, [value]) returns the selection after setting the named attribute with the value. As a value, we can use a function whose arguments are our own data because we bound the data to the selection using datum().


Summary

We drew a point, actually a SVG circle, with our own data using D3's datum() and set the attributes of the element using D3's attr().


What's next?

Now it's time to handle streaming! We are going to stream the axis.

go back | go Next

2013년 8월 31일 토요일

Realtime Streaming Chart using D3.js - 01. Draw SVG and Axes

The Code and the Result


The process in a real world

When you draw a graph, what is needed?
First of all, you need a pen to draw with, and a paper to draw on.

What's next?
You determine the physical size of the graph and the location of the graph in the paper.

Then?
You draw the outline of the chart, specifically, the axes.
And begin to think about the range of the data, in other words, the logical size of the graph, that is to say, a Scale.

Yes. that's exactly what the code is doing.


The analogy in the code

The pen is the D3.js
The paper is the 'svg' tag and the physical size is width/height attributes of svg
The location can be set using 'g' tag
The axes are instantiated by calling axis function
The scale can be calculated by d3.scale


The basic

You need to 'append'(or 'insert') some HTML tag to see anything happen in the screen.
That is to say, all you did without 'append'(or 'insert') are all logical things that produce no physical effects.


D3 stuff in this code

d3.select("body")
  d3.select(selector) returns a D3 'Selection'
  In a word, D3 'Selection' is a wrapper of the selected element(s).
  You can understand the 'Selection' by reading the API references, but I strongly suggest to read this article. It may takes some time to understand, but it deserves.


selection.append("svg")
  selection.append(selector) returns a new selection containing the appended elements(here, 'svg' element).


selection.attr("class", "axis")
  selection.attr(name, value) returns the selection after setting the 'name' attribute with the 'value'.
  selection.attr(name) returns the current value of the 'name' attribute.


d3.scale.linear().domain([minData, maxData]).range([minPixel, maxPixel])
  d3.scale.linear() returns the linear scale function which is capable of calculating the scaled result.
  domain([minData, maxData]) returns the linear scale function after setting the 'domain' of the scale.
  domain() returns an array which contains the current minData and maxData.
  range([minPixel, maxPixel]) returns the linear scale function after setting the 'range' of the scale.
  range() returns an array which contains the current minPixel and maxPixel.
  As a result, this sentence returns a linear scale function which is capable of calculating a pixel value from a data.
  There are more scale function like sqrt, pow, log, quantize, threshold, quantile, identy, ordinal, category10, category20, category20b, category20c. Please see the API references for those various scales.


d3.svg.axis().scale(xScale).orient("bottom")
  d3.svg.axis() returns the axis function which applies the axis to a selection or transition.
  scale(scaleFunction) returns the axis function after setting the scale with the scaleFunction.
  scale() returns the current scale function.
  orient(orientation) returns the axis setting the orientation of the axis. Orientation is a string, "top", "bottom", "left", "right".
  orient() returns a string which represents the current orientation.


selection.call(functionA)
  This pattern is frequently used when you create axis.
  The sentence above is equivalent to 'functionA(selection)'


What's next?

Now it's time to draw data points.

go back | go Next

2013년 8월 28일 수요일

Realtime Streaming Chart using D3.js - 00. Intro

What is D3.js

D3.js is the most popular and powerful Open Source Data Visualization library.
Some other data visualization libraries like Rickshaw.js and nvd3.js are based on this D3.
You can produce realtime, interactive charts(or graphs) as well as static charts(or graphs) based on SVG, basically.

You can see a bunch of splendid examples here.
The following is just a part of those 120+ examples.(It's still growing though)


What this post wants to say

Actually I needed a 'Realtime Streaming Point Chart'.
That is to say, the X-axis represents the time series, and the X-axis is streaming with its data points as time goes by.

At first, I just wanted to find appropriate example and to modify it a little bit. ^^
I found some realtime streaming 'Line' chart here, and 'Bar' chart here.
But I couldn't find the realtime streaming 'Point' chart.

So I made up my mind to study D3.js and finally I made it!!!

I will show how to make it through 7 steps.

01. Draw SVG and Axes
02. Draw a Point
03. Streaming the Axis
04. Change X-Axis to the time series axis
05. Change a data to a time
06. Moving points according to the time
07. Apply Clipper


Prerequisites

Not much.
Just fundamental experiences on HTML and JavaScript.
And some effort to study the concepts of D3.


What you can get

You will get a Realtime Streaming Point Chart.
And you will find yourself familiar with the D3.js.


Benefits


I will use jsFiddle, so you can test all the codes in this way and that way.
It will help you understand D3's mechanism.

For D3 concepts, I'll basically provide very short instructions to speed up learning. Instead of explaining everything by myself, I'll provide proper links to great articles written by Gurus.

I approach to those D3 concepts in a timely manner, which means I'll first describe what we actually needed rather than following the order of the D3 references book.

2013년 6월 5일 수요일

eGovFramework + Hibernate + CUBRID

전자정부Framework(eGovFrame, http://www.egovframe.org)은 J2EE에서 가장 널리 사용되는 Spring Framework를 기반으로 여러 공개SW를 활용하여 웹 프로젝트에서 공통으로 사용되는 많은 기능들을 제공한다.

eGovFrame 홈페이지에도 설치 및 구동에 대한 지침이 잘 정리되어 있으나, DB로는 MySql, Persistence Layer로는 iBatis(현재는 MyBatis) 기반으로 작성이 되어 있어, MySql이나 iBatis가 아닌 다른 요소들을 적용하려면 미세하나마 조정이 필요하다.

본 문서에서는

  • 2013.06.04 현재 최신 eGovFrame 개발환경인 V2.5를 설치하고,
  • CUBRID 9.1과 Hibernate 4.2를 설치하고
  • eGovFrame 홈페이지에서 제공하는 ormSimpleGuide를 실행하여, eGovFrame + Hibernate + CUBRID 개발환경 설정 성공을 확인해 보는 것 까지를 범위로 한다.


사전 알림 사항

  • 아래의 내용은 Windows 7 - 64bit에서 구성
  • JDK는 32bit용을 설치한다.(32bit JDK에서만 eGovFrame의 Eclipse가 실행됨)
  • 개발환경 구성의 최상위 디렉토리는 '개발홈'으로 칭하며 'D:\eGov-Dev'로 한다.


eGovFrame 개발 환경 다운로드

http://www.egovframe.org/EgovDevEnvRelease.jsp?menu=3&submenu=2 에서 다음의 링크를 클릭하여 개발홈에 다운로드 받는다.


eGovFrame 개발환경은 압축을 푸는 것으로 설치는 끝난다.


eclipse를 실행하여 Workspace를 아래와 같이 지정한다. workspace폴더에 각종 설정파일들이 있으므로 반드시 아래의 디렉토리를 지정해야 한다.


만약 위 화면이 나오지 않고 eclipse가 실행이 되지 않으면, eclipse.ini 에서 아래 내용을 추가하여 JVM의 위치를 지정해준다.(eclipse.ini 파일에 익숙하지 않다면 그냥 맨위 라인에 추가하면 된다)

ex)
-vm
C:/Program Files (x86)/Java/jre7/bin/javaw.exe


아래 그림의 우상단에 eGovFrame Perspective가 활성화되어 있다면 eGovFrame용 eclipse는 정상적으로 설치되었다. 정상 설치되었으면 eclipse는 종료한다.
만약, 그렇지 않다면, JVM이나 workspace의 위치 지정이 잘못된 것이니 위의 내용대로 다시 수행해본다.


CUBRID 설치


CUBRID는 국내에서 개발된 공개SW DBMS로 공식 홈페이지는 영문으로된 http://www.cubrid.org 이며, http://www.cubrid.com 를 통해 한글로도 볼 수 있다.
CUBRID의 엔진은 GPLv2 or Higher로 되어 있고, CUBRID의 인터페이스는 BSD로 되어 있다.
즉, BSD 라이선스를 적용받는 CUBRID JDBC driver를 통해 CUBRID DB엔진을 사용하는 어떤 서비스를 만들더라도 우리가 만든 그 서비스의 소스는 공개할 필요가 없다.
자세한 내용은 http://www.cubrid.com/zbxe/bbs_oss_guide/32249 를 참조한다.


CUBRID는 홈페이지를 통해 개발홈에 다운로드 받는다. http://www.cubrid.org/


CUBRID 설치 폴더를 개발홈 아래에 'CUBRID-9.1'로 미리 만든다.


실행파일을 더블클릭하여 설치를 시작하면 9.1에 대한 아래의 안내가 나온다. 다음 클릭.


설치 위치를 위에서 미리 만든 폴더로 지정하고 다음 클릭


아래와 같은 안내가 뜨는데, '예'를  눌러 계속 진행한다.


아래와 같은 라이선스에 동의하고 다음 클릭


설치 옵션에서 전체 설치 선택 후 다음 클릭


브로커 버전과 데이타베이스 버전의 호환성 정보 확인에 '예'를 클릭


설치 최종 확인 창에서 다음 클릭


설치 진행 중 샘플 DB 생성을 묻는 창에서 '예' 클릭


아래와 같이 demodb 생성이 진행


아래와 같이 CUBRID 설치 완료


완료를 누르면 개발자 페이지가 열리고 아래와 같이 작업관리줄에 CUBRID 로고인 바람개비 아이콘이 활성화된다.


CUBRID Manager 설치


CUBRID를 관리할 GUI 방식의 Manager를 설치한다. CUBRID Manager는 64bit의 JDK가 반드시 필요하다.

http://www.cubrid.com/zbxe/download 에서 아래의 링크를 통해 개발홈 폴더에 다운로드 한다.


더블 클릭하여 설치를 시작한다.
설치 언어로 '한국어'를 선택하고,
다음을 클릭하여 설치를 시작,
사용권 계약에 동의하고,
바로가기는 개인 편의에 맞게 선택한다.

설치위치는 default 값이 아래와 같은 지 확인하고 '설치' 버튼을 누른다.


아래와 같이 설치가 완료되면 다음을 클릭하고 마침을 클릭하여 설치를 종료한다.


바로가기나 실행파일을 통해 CUBRID Manager를 실행한다.

혹시 아래와 같은 에러가 발생한다면 cubridmanager.ini 파일에서 JVM의 위치를 64bit JVM으로 지정해준다.


CUBRID Manager가 성공적으로 실행되면 일반적인 eclipse처럼 Workspace를 묻는데 Default 값이 아래와 같은지 확인하고, '확인' 클릭


성공적으로 실행되고 아래와 같이 Update 요청 화면이 뜨면, '완료'를 클릭하여 업데이트를 실시한다.


업데이트 중 아래와 같은 인증서 확인 창이 뜨면 체크하고 확인 클릭


업데이트 후 재시작을 묻는 창에 '예'를 클릭하고 재시작한다.


CUBRID demodb 데이타베이스 시작


Hibernate 실습 예제에서 사용할 demodb를 시작한다.
demodb는 CUBRID 설치과정에서 생성한 default 데이타베이스이다.

CUBRID Manager에서 아래와 같이 localhost를 우클릭하여 '연결'을 선택한다.


CUBRID 호스트 창에서 아래와 같이 비밀번호 란에 admin 을 입력하고, 비밀번호 저장 란에 체크하여 '연결'을 클릭한다.


admin계정의 비밀번호는 아래와 같은 조건이 있으므로, 적절한 비밀번호를 입력한다.


재로그인 창이 뜨면 '예'를 클릭하여 CUBRID Manager에 재로그인한다. CUBRID Manager가 재시작되지는 않고 localhost에 로그인만 다시 진행된다.


localhost에 재로그인 후 아래와 같이 CUBRID Manager의 demodb을 우클릭하여 '데이터베이스 시작'을 클릭한다.


아래와 같이 demodb가 시작되고 아이콘에 녹색 화살표가 생긴다.


Hibernate 실습 예제 프로젝트 생성


eGovFrame에서는 Hibernate 실습 예제를 제공한다.
실습 예제는 Hibernate를 통해 DBMS에 테이블을 생성하고 삭제하는 것을 JUnit으로 테스트 한다.


eGovFrame의 ORM 관련 문서인
http://www.egovframe.org/wiki/doku.php?id=egovframework:rte2:psl:orm 의 최하단의 링크를 통해 개발홈에 다운로드 받고 압축을 푼다.


이클립스를 구동하고 Package Explorer에서 우클릭하여 Import... 클릭


Existing Projects into Workspace를 선택하고 Next 클릭


Browse..를 클릭하여 ormsimpleguide 폴더 선택


Copy projects into workspace를 선택하고 Finish 클릭한다.
Copy하였으므로 앞으로 본 문서에서 나타나는 ormSimpleGuide 프로젝트의 물리적 위치는 개발홈/ormSimpleGuide 가 아니라
개발홈/eGovFrameDev-2.5.1-FullVer/workspace/ormSimpleGuide 임에 유의한다.
혼선을 피하려면 다운로드 및 Import 를 위해 사용한 개발홈/ormSimpleGuide 폴더는 지워도 무방하다.


아래와 같이 ormSimpleGuide 프로젝트가 생성된다.


Hibernate 다운로드


ormSimpleGuide 프로젝트의 lib 폴더에 hibernate 라이브러리가 포함되어 있으나, CUBRID와 호환되지 않는 버전이 포함되어 있어 최신 버전의 Hibernate를 다운로드 해야 한다.

http://www.hibernate.org/downloads에서 아래 그림처럼 4.2.2.Final ZIP을 개발홈에 다운로드 받고, 압축을 푼다.


ormSimpleGuide 프로젝트에 Hibernate 4.2.2 적용


위에서 잠시 언급했지만 ormSimpleGuide에 포함된 버전의 Hibernate 라이브러리는 우리가 사용할 DBMS인 CUBRID를 지원하지 않는다.

Hibernate가 CUBRID를 지원하는 지 확인하는 방법은 'Hibernate-core-#.#.#.jar'의 압축을 풀어 'org/hibernate/dialect/CUBRIDDialect.java' 파일이 있는 지 확인하면 된다.

위에서 다운받은 4.2.2는 CUBRIDDialect.java 파일을 포함하고 있어 CUBRID를 지원하므로, ormSimpleGuide의 구버전 Hibernate 라이브러리를 제거하고 4.2.2를 적용한다.

개발홈/hibernate-release-4.2.2.Final/lib/required 에서 아래와 같이
hibernate-core-4.2.2.Final.jar,
hibernate-commons-annotations-4.0.2.Final.jar,
hibernate-jpa-2.0-api-1.0.1.Final.jar,
jboss-logging-3.1.0.GA.jar,
jboss-transaction-api_1.1_spec-1.0.1.Final.jar
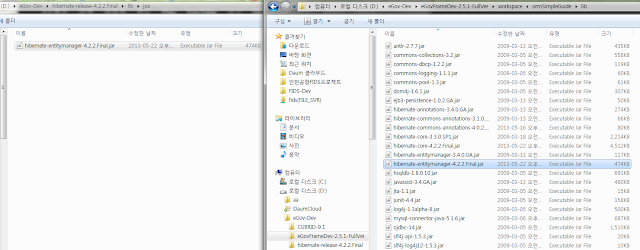
5개의 파일를 ormSimpleGuide 소스가 있는 개발홈/eGovFrameDev-2.5.1-FullVer/workspace/ormSimpleGuide/lib에 복사한다.


개발홈/hibernate-release-4.2.2.Final/lib/jpa 에서 hibernate-entitymanager-4.2.2.Final.jar 를 개발홈/eGovFrameDev-2.5.1-FullVer/workspace/ormSimpleGuide/lib 에 복사한다.


바뀐 리소스를 eclipse에 반영하기 위해 아래와 같이 프로젝트를 refresh한다.


eclipse의 ormSimpleGuide를 우클릭하고 아래와 같이 Configure Build Path...를 클릭한다.


Libraries탭을 선택하여 아래와 같이 구버전의 Hibernate 라이브러리를 선택하고 Remove를 클릭하여 삭제한다.


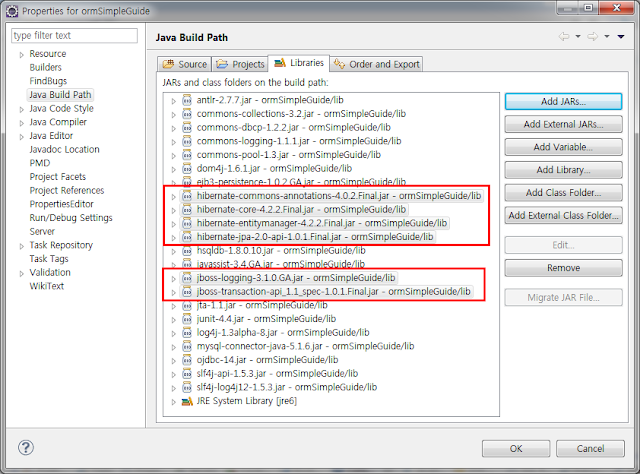
Add JARs... 를 클릭하여 Hibernate 최신 버전에서 복사한 6개의 라이브러리를 아래와 같이 추가한다.


아래와 같이 Hibernate 라이브러리 교체 내역을 확인하고 OK를 누른다.


ormSimpleGuide 프로젝트에 CUBRID 적용


ormSimpleGuide는 Default로 HSQL DB를 사용하도록 설정되어 있어, CUBRID를 사용하도록 설정을 변경해야 한다.

DB연결 부분의 설정파일은 'ormsimpleguide/resources/META-INF'에 있는 persistence.xml 이다. 


Package Explorer 상에서 더블 클릭하여 편집기를 열고 아래와 같이 HSQL 정보를 주석처리하고 CUBRID 정보를 추가한다.

CUBRID 정보는 아래와 같으며, 자세한 내용은
아래 hibernate.connection.url의 value값 중 'dba::' 는 dba 계정의 비밀번호가 없음을 의미한다. CUBRID 설치 시 생성한 demodb에는 dba 계정이 비밀번호 없이 자동으로 생성된다. 추후 비밀번호를 생성하면 'dba:비밀번호:'로 수정하면 된다.

<!-- CUBRID -->
<property name="hibernate.connection.driver_class" value="cubrid.jdbc.driver.CUBRIDDriver"/>
<property name="hibernate.connection.url" value="jdbc:CUBRID:localhost:33000:demodb:dba::?charSet=utf-8"/>
<property name="hibernate.dialect" value="org.hibernate.dialect.CUBRIDDialect"/>


http://www.cubrid.com/zbxe/developer에서 JDBC 드라이버를 다운받아 개발홈/eGovFrameDev-2.5.1-FullVer/workspace/ormSimpleGuide/lib에 저장한다.


리소스 변경을 반영하기 위해 ormSimpleGuide를 refresh하고,
다운받은 JDBC 드라이버를 eclipse에서 ormSimpleGuide의 라이브러리로 등록한다.